To be fair to Gov. Kevin Stitt, when he announced on May 29 that Oklahoma would be moving into Phase 3 of his Open Up and Recover Safely plan, trends for new COVID-19 cases and hospitalizations were on the decline.
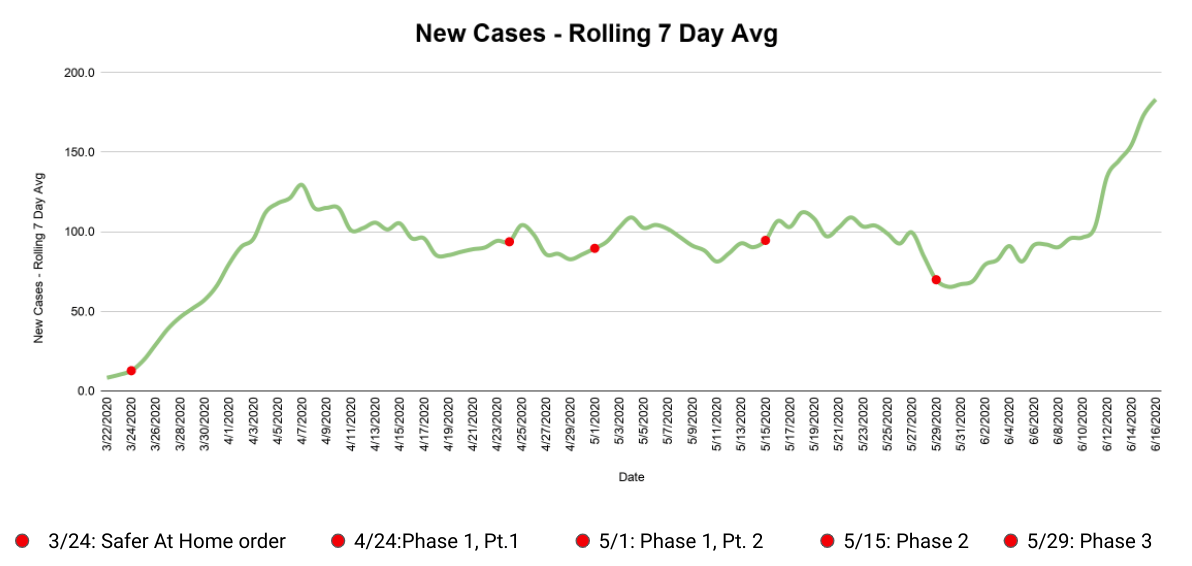
From May 22 to May 30, the rolling seven-day average of new cases in Oklahoma dropped from 109 to 65 cases per day — a new low since our peak back on April 7, of 129 cases per day.
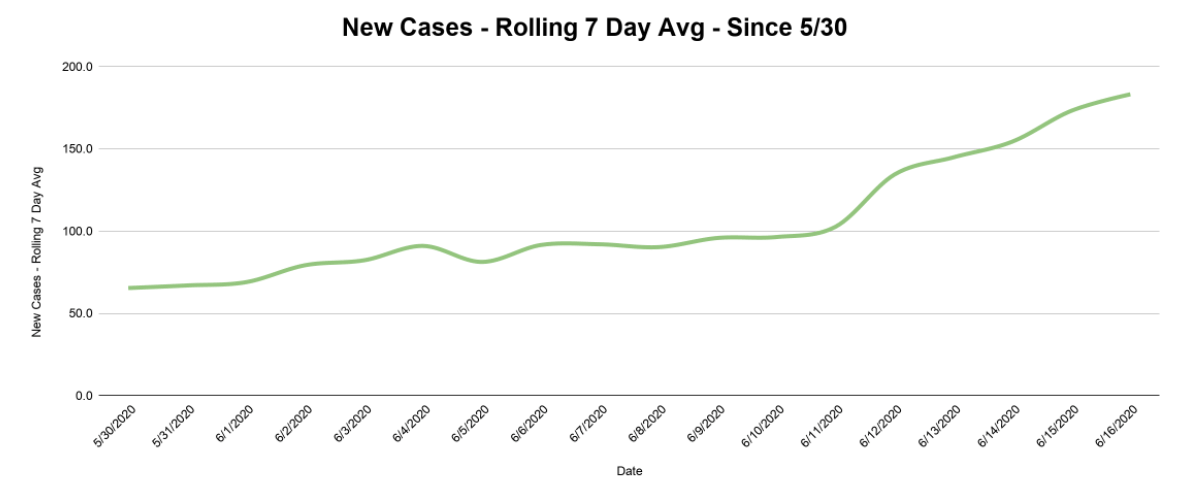
But if a seven-day downward trend is enough reason to move along to the next phase of reopening, then a two-plus week upward trend is, at the very least, cause for alarm. The graph below shows the rolling seven-day average of new cases nearly triple over the past 17 days, from that May 30 low to a new high of 183 new cases per day on June 16.
The good news is that with 8,645 total positive cases as of June 16, Oklahoma still consistently ranks in the bottom half of U.S. states for cases per 100,000 people. Our state’s ICU bed availability has also remained consistent: the Oklahoma State Health Department reported 32 percent of our ICU beds available on May 15, followed by 31 percent on June 1 and 32 percent on June 15.
But the June jump in new cases ranks Oklahoma among the highest percentage increases in the country over the past two weeks, per NPR’s tracking dashboard. We also beat April 4’s record high of 171 new cases in one day three times over the past week, with 222 new cases on June 12, 225 on June 13 and 228 and June 16. The overall numbers might still be low in comparison to other states, but the sharp upward trend is worrisome.
We can use the June 16 seven-day average of 183 new cases per day, our state’s hospitalization rate of 13 percent (1,130 total hospitalized divided by 8,645 positive cases) and mortality rate once hospitalized of 32 percent (363 deaths divided by 1,130 hospitalizations) to get an idea of how things might play out in the future at the current rate.
Using those variables, you can estimate that over the next 30 days we might have another 5,490 cases, 714 new hospitalizations and 228 deaths. If those rates stay fairly steady, it would take only 48 days to double the number of deaths accumulated in the nearly three months since Oklahoma’s safer at home order was first issued on March 24.
Are higher numbers the result of more testing?
One popular theory currently making the rounds is that the recent uptick in numbers is the result of increased testing. President Donald Trump made the link on June 15, saying, “So the media likes to say we have the most cases, but we do, by far, the most testing (…) We’re going to have more cases because we do more testing. Otherwise, you don’t know if you have a case. I think that’s a correct statement.”
So is that the case in Oklahoma?
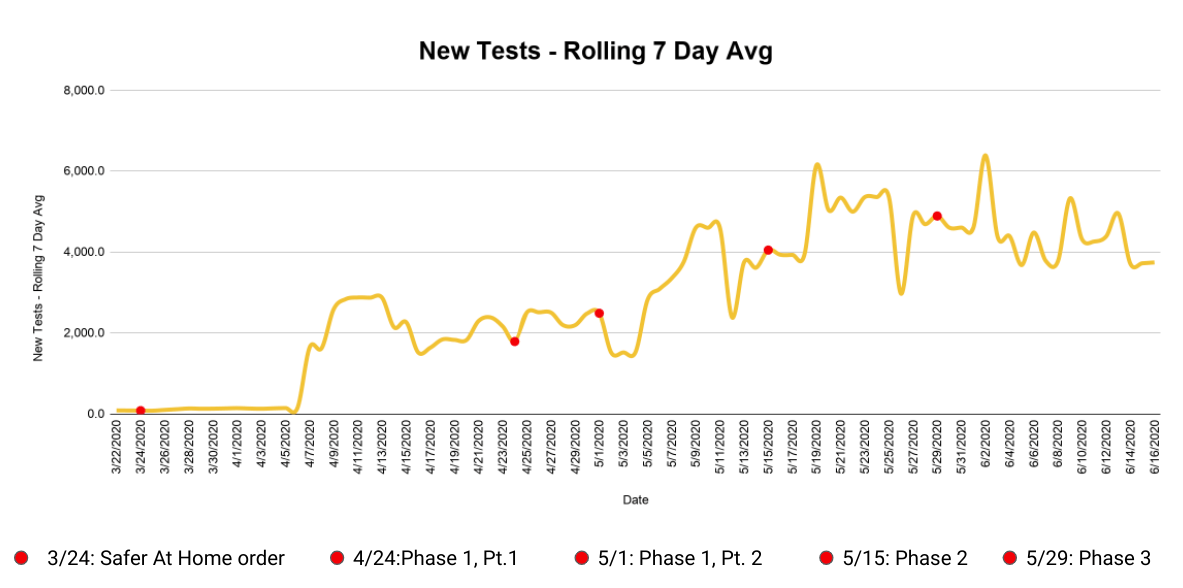
Sadly, no. The rolling average of new tests over the same time period has not increased to match the jump in cases. The below graph shows a relatively steady level of testing.
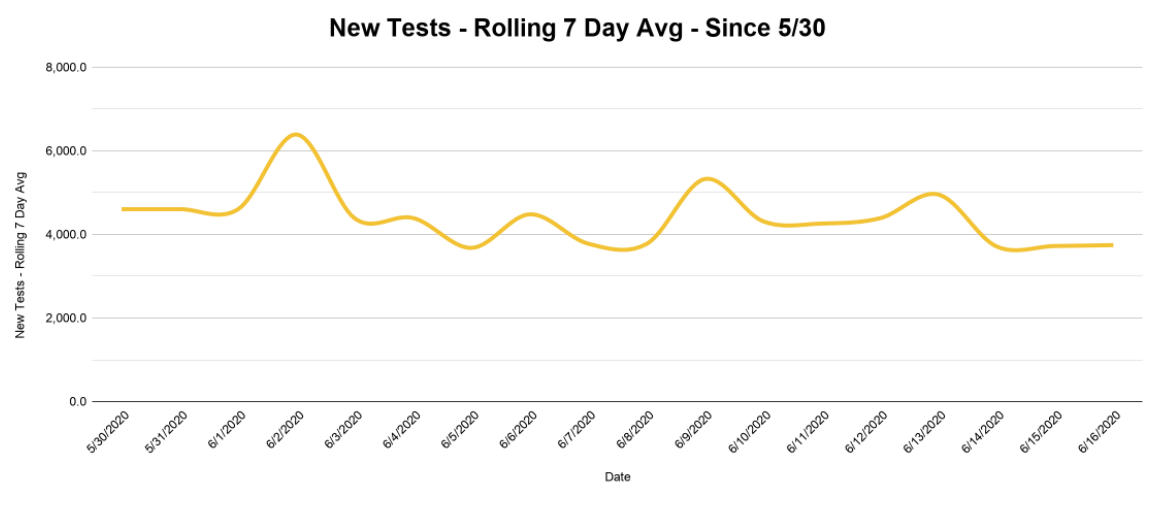
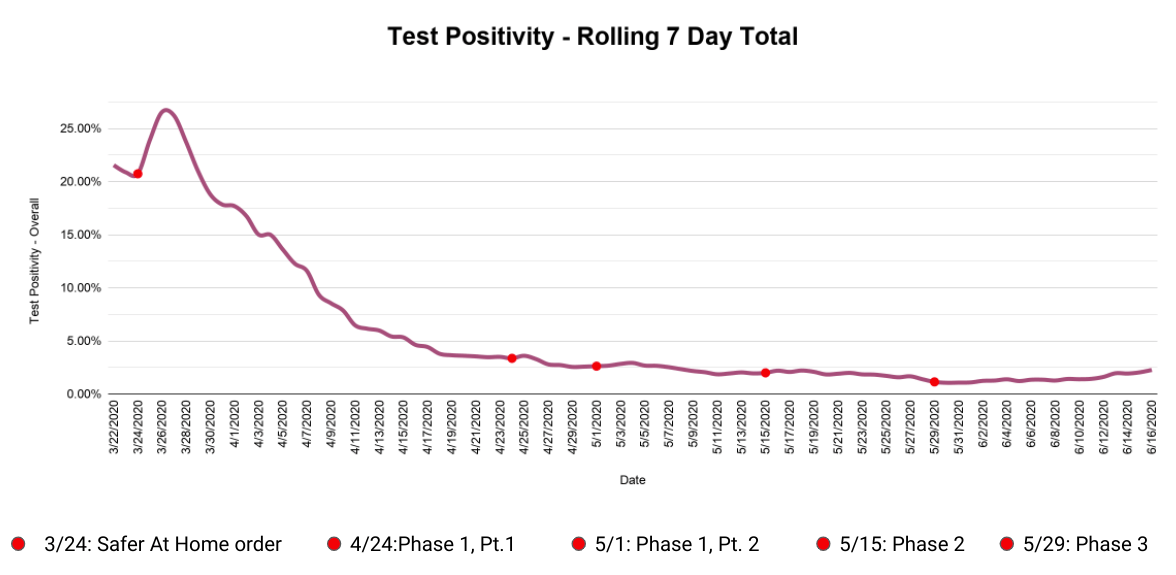
The number to keep an eye on is test positivity — that is, not the total number of positives, but the number of positives relative to the number of tests. Since testing is remaining about the same and the number of positives is going up, we can conclude that the rate of infection is going up.
In a June 12 interview on CNN, National Institute of Allergy and Infectious Disease director — and literal public health poster boy — Dr. Anthony Fauci explained that if hospitalizations and test positivity are increasing along with new cases, then a spike is a legitimate concern.
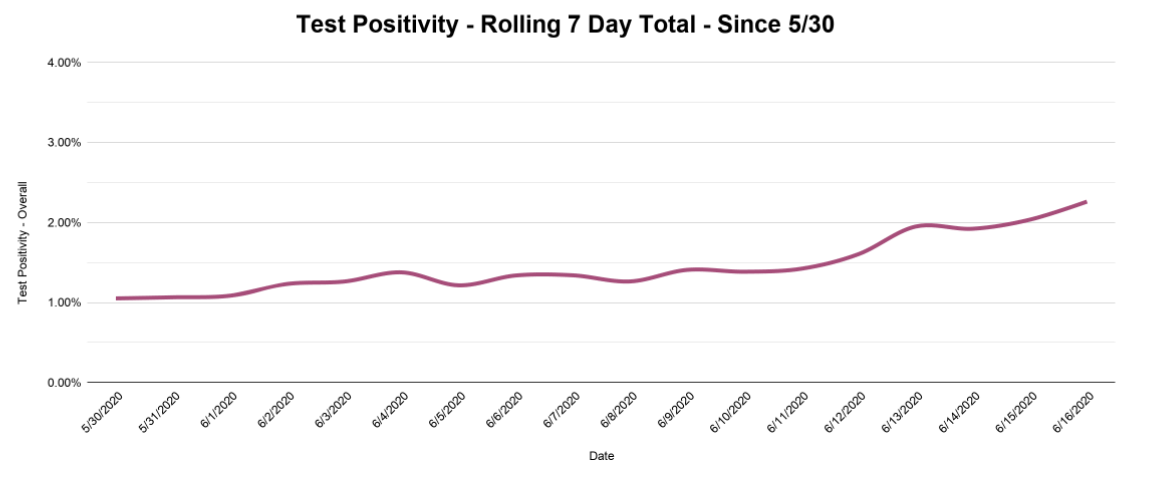
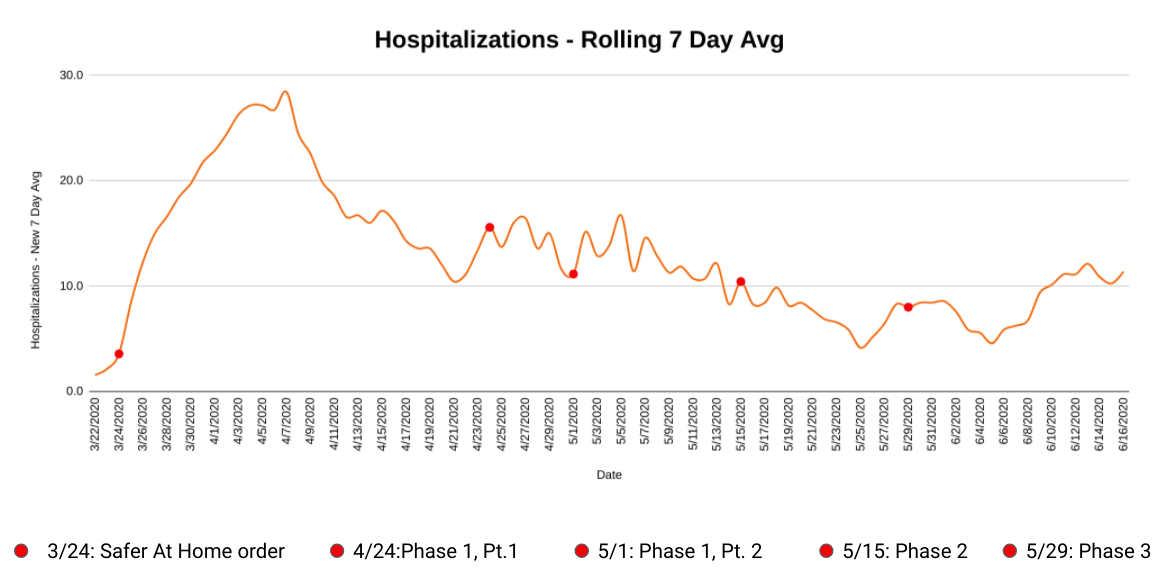
As you can see, rolling seven-day totals for test positivity (above) and hospitalizations (below) are both on the rise. Seven-day cumulative test positivity has climbed to 2.26 percent, a number we haven’t seen since May 8.
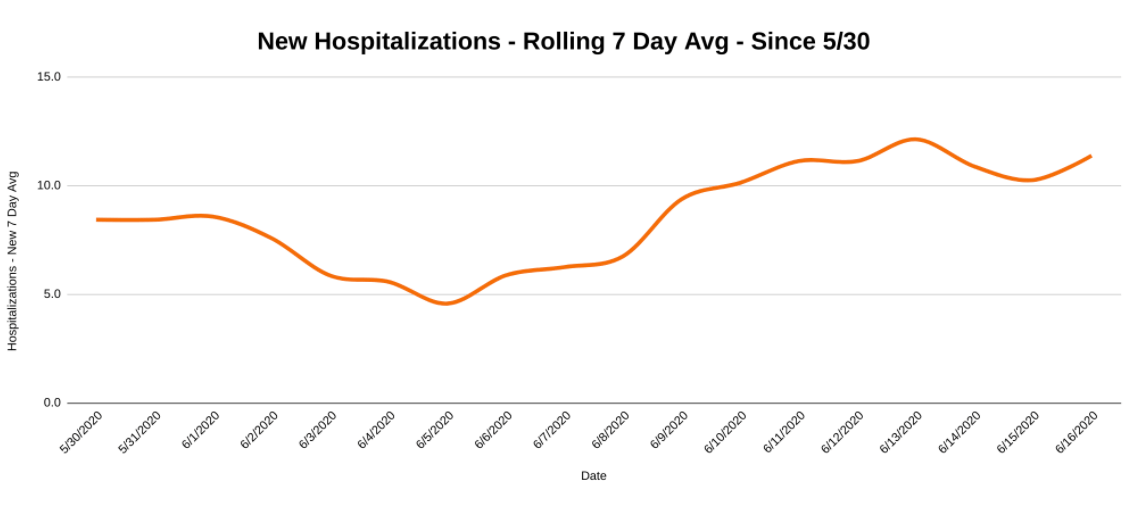
And while the current rate of new hospitalizations per day, seen above, isn’t quite half of the rate of 28 per day that we had during the peak in early April, it does confirm that there is some substance to the recent bump in new cases.
So, whose fault is it?
There isn’t really a question about whether cases are on the rise. The numbers are right there for us to see. The argument currently raging on the internet and elsewhere is what — or who — is responsible. In a surprise to literally no one, this squabble is now split along political party lines.
The left has blamed the right for spreading the virus during protests against government-imposed lockdowns, while the right has blamed the left for their large public protests in the wake of George Floyd’s death. President Trump’s upcoming campaign rally in Tulsa on Saturday has also become a flashpoint in the public spat.
Thankfully, we have trained and deployed an army of contact tracers in our state and county health departments to help shed light on the source.
The answer? It seems we are all to blame.
Oklahoma City Mayor David Holt wrote in Facebook post on June 13, “At present, as the epidemiologists trace the cases, there is no unifying explanation. We are left with the presumption that, generally, we’re just not taking the same level of care.” (Holt provided additional information June 16 regarding an increase in cases among people in the 18 to 35 age group.)
Dr. Bruce Dart, director of the Tulsa City-County Health Department, echoed Holt in comments the same day, saying private events and “quarantine fatigue” are responsible for the current spike.
“There was a funeral that had a large attendance, and we’re finding quite a few cases from that,” Dart said. “But other than that, it’s broad community spread from being out in the community and not taking those necessary precautions we’ve been talking about.”
Quarantine fatigue doesn’t care which political party you support. Staying cooped up in our homes during the summer months, when we are used to socializing and partaking in outdoor activities, has taken an emotional toll.
But the rising COVID-19 numbers are a reminder that even as the warm weather beckons and businesses open up around the state, staying home when possible can still help slow the spread of disease. And, if you do go out, it’s still important to follow CDC guidelines by practicing social distancing and wearing a face covering in public when other social distancing measures are difficult to maintain.
If you still need proof that these techniques are important, there is plenty of evidence showing that they help reduce the spread of the virus. Remember, not everyone can simply stay home. We are all connected by our decisions in times like these. Hence the name, public health.
For an explanation of the methodology used to make the above graphs and some thoughts on how to make sense of all the COVID-19 data you see, please see my previous article on NonDoc, published on June 10.
The graphs below show the same information as the ones above, but zoomed out for the entire length of the pandemic. The red dots represent the different stages of Oklahoma’s reopening in chronological order:
- The initial stay-at-home order
- Phase one, part one
- Phase one, part two
- Phase two
- Phase three
(Correction: This article was updated at 10:50 a.m. Wednesday, June 17, to reference the percentage of ICU beds available correctly. NonDoc regrets the error.)
